Debugging Python Like a Boss
def make_pie(self, ingredients):
    print '******WHAT IS GOING ON HERE******'
    print ingredients
    self.oven.preheat()
    print self.oven.temperature
Is the above code snippet similar to your tried-and-true debugging techniques? Yea, that used to be me too. Honestly, it's not so bad. Slap in some prints, run the code, and see what is happening. Sure you usually have to scroll through other output that gets jumbled into STDOUT, but you get what you want. At least, when you know what you want. Usually you don't. If you knew what to inspect, you probably wouldn't need the prints in the first place. Instead, you throw a couple prints in near where you think the problem is, then iteratively move them closer and closer to the buggy code. Hooray binary search!
Thankfully, there is a better way. Since the first segfault in C, a class of tools called debuggers have emerged with every language. Python is no exception, with a default one baked right in. There are also some cool ones developed by the community. Through the rest of this post, we'll take a tour of a few popular ones.
pdb

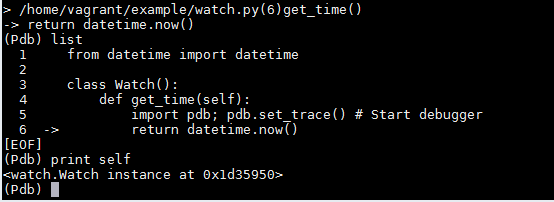
First up is Python's built-in debugger, pdb. It sports a basic command-line interface and has many of the features you need in this kind of tool. The help system points you to the commands you can run, which include stepping through the code, navigating the call stack, and setting breakpoints.
A couple things this one lacks: tab completion of local variables and some kind of coloring or better layout of code and stack traces.
No matter what debugger you end up settling on, pdb is worth knowing for two reasons: 1) it is always available in Python and 2) many of the other debuggers are a superset of what pdb offers, so chances are you already know it!
Bottom line: Solid default, but use something better if it's available.
pydbgr

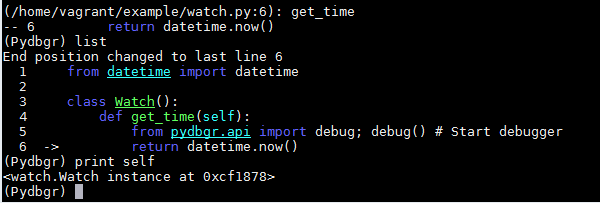
Next up is pydbgr (trepan for Python 3.2+). This project is a rewrite of the pydb debugger. It offers a very similar set of commands to pdb, although some of the helpful aliases like “u” for “up” are missing.
One thing this debugger does do well is fine-grain control over execution flow. You can pass commands like step an additional number to get it to repeat the command that many times (i.e. step 5). You can also tell the debugger to only stop on certain events, like function calls and returns, which can save you a lot of needless steps.
Another feature this debugger offers that others don't are very low level inspection of symbols via commands like examine and disassemble. I'm honestly not sure when this would ever prove useful in my web development, but your work could be different.
Bottom line: The features it adds to pdb are not ones I find useful in day-to-day web dev.
pudb

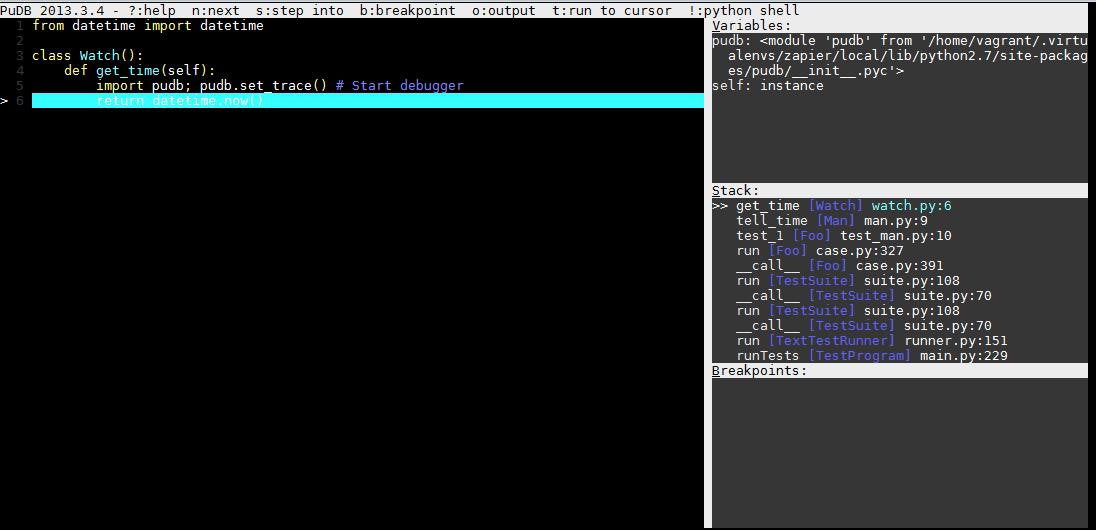
The obvious thing to highlight on this one is the mini gui that is rolled into this terminal based debugger. That's right, this is not a separate window, this is in the terminal. Apart from a loud set of default colors (which can be customized or selected from a default set of themes), this is a novel take on debugger UX.
The left-panel shows the code for the current file (or other files as you move up and down the stack). Navigation is superb, with arrow keys (and “hjkl” for Vim folk), search, and the ability to open other modules with a fuzzy-match search. Combine this easy movement with a shortcut key to execute code to the current cursor position and you have a very intuitive and friendly way step through programs. Of course, pudb still provides the regular slew of breakpoint and stepping commands to control execution as you see fit.
On the right, you have several panels that track current local variables, the stack, and existing breakpoints. These provide a nice change from a typical terminal debugger where you are typing locals(), where, or using tab completion to introspect the current frame.
One other neat bit about this debugger is its postmortem support. When you hit an exception, the debugger prompts you with a quick key to see the exception. It also offers to drop you right to the line that the exception happened on, with the stack and variables intact.
Bottom line: Best UX of the bunch; especially useful for following stack traces.
ipdb

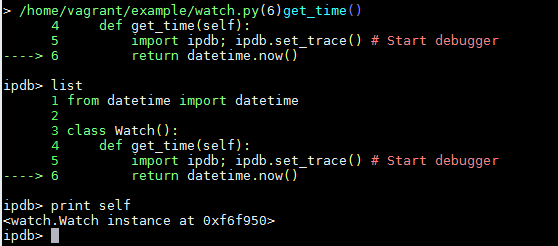
Last up is iPython's ipdb. Like its *pdb brothers, the interface is a simple command-line and the help system is a great place to start digging in. What makes this one different from the rest is that it uses an iPython shell, so all the tab-completion and object introspection goodness of iPython is available to help you see exactly what is going on. Combine that with great syntax highlighting and a where command with the best formatting, and you have the perfect weapon to slice through your bug.
Bottom line: Most useful out of the box and my personal favorite.
I will mention that, depending on the situation, I switch to pudb. It really is the best for flipping through files to figure out what code is executing (like when you have to drill into a third party library that is misbehaving). Why I prefer ipdb over it for most situations is that often times I'm in code I know well enough that I don't need the big picture. I need to know what the state is like in a particular function. Combined, they are an invaluable set!
Comments powered by Disqus